Overview
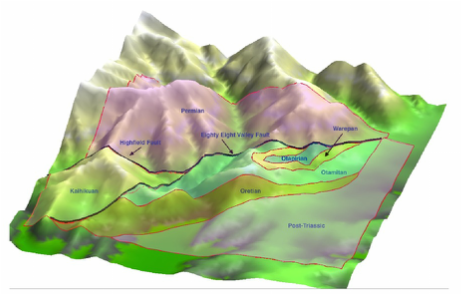
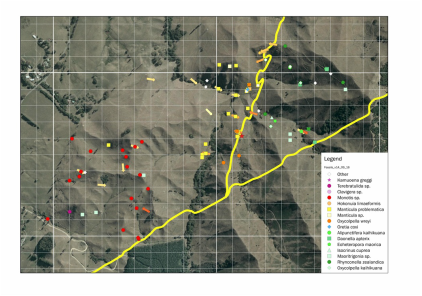
The use of GPS and GISIn order accurately to record all the finds and observations we make, we use GPS to measure their location. The data are then entered into a database and mapped using a geographical information system (GIS). The GIS enables us to overlay different types of information, and to display the results in different ways. The map above shows an earlier map of the geology (by Grant Mackie) draped over a 3D model of the landscape.
|
Fossil evidenceThe Highfield area is rich in fossils, and these provide invaluable information on the age, environment of deposition and geographic distribution of the rocks. To date, over thirty different species have been identified, including brachiopods, bivalves, gastropods, crinoids, anthozoa and ammonites. With the help of GPS and GIS, we are developing detailed maps of all the fossil finds, which are helping to make sense of the stratigraphy.
|
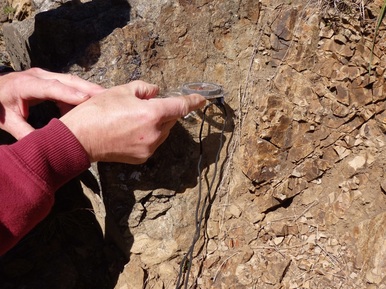
Dip and strikeIn order to trace the bedding in the rocks at Highfield, and to work out the stratigraphy, we take measurement of the dip and strike of bedding planes from exposures of the rocks. Based on these measurements, it is possible to detect the presence of folding in the rocks strata, and to predict where the strata are likely to crop out at the surface.
|
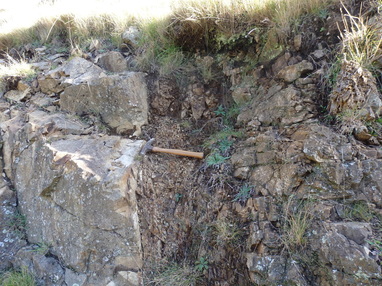
FaultsSeveral faults can be seen in the area, exposed in rock outcrops, but mapping them is difficult because they leave few traces on the landscape. Clues have to be sought in subtle features, such as knicks in ridge lines, areas of broken scree, and hummocky or disturbed terrain. When measurements of the dip and direction of the faults can be made, GIS techniques can also be used to predict the pathway of the faults on the ground surface.
|
